Earn New
Analytics
Dollars next to every broadcast, sequence, and form, and the two numbers behind every percentage.
What it is
Most email analytics are open rates, and open rates have been mostly fiction since Apple started opening mail on its own in 2021. I wanted numbers I could actually make decisions with.
Kōlea shows you dollars next to every broadcast, sequence, and form, and the two numbers behind every percentage. Machine opens are spotted and left out. Every send gets a score against your own history, not some industry average.
01 Analytics
Two dials, two different fixes
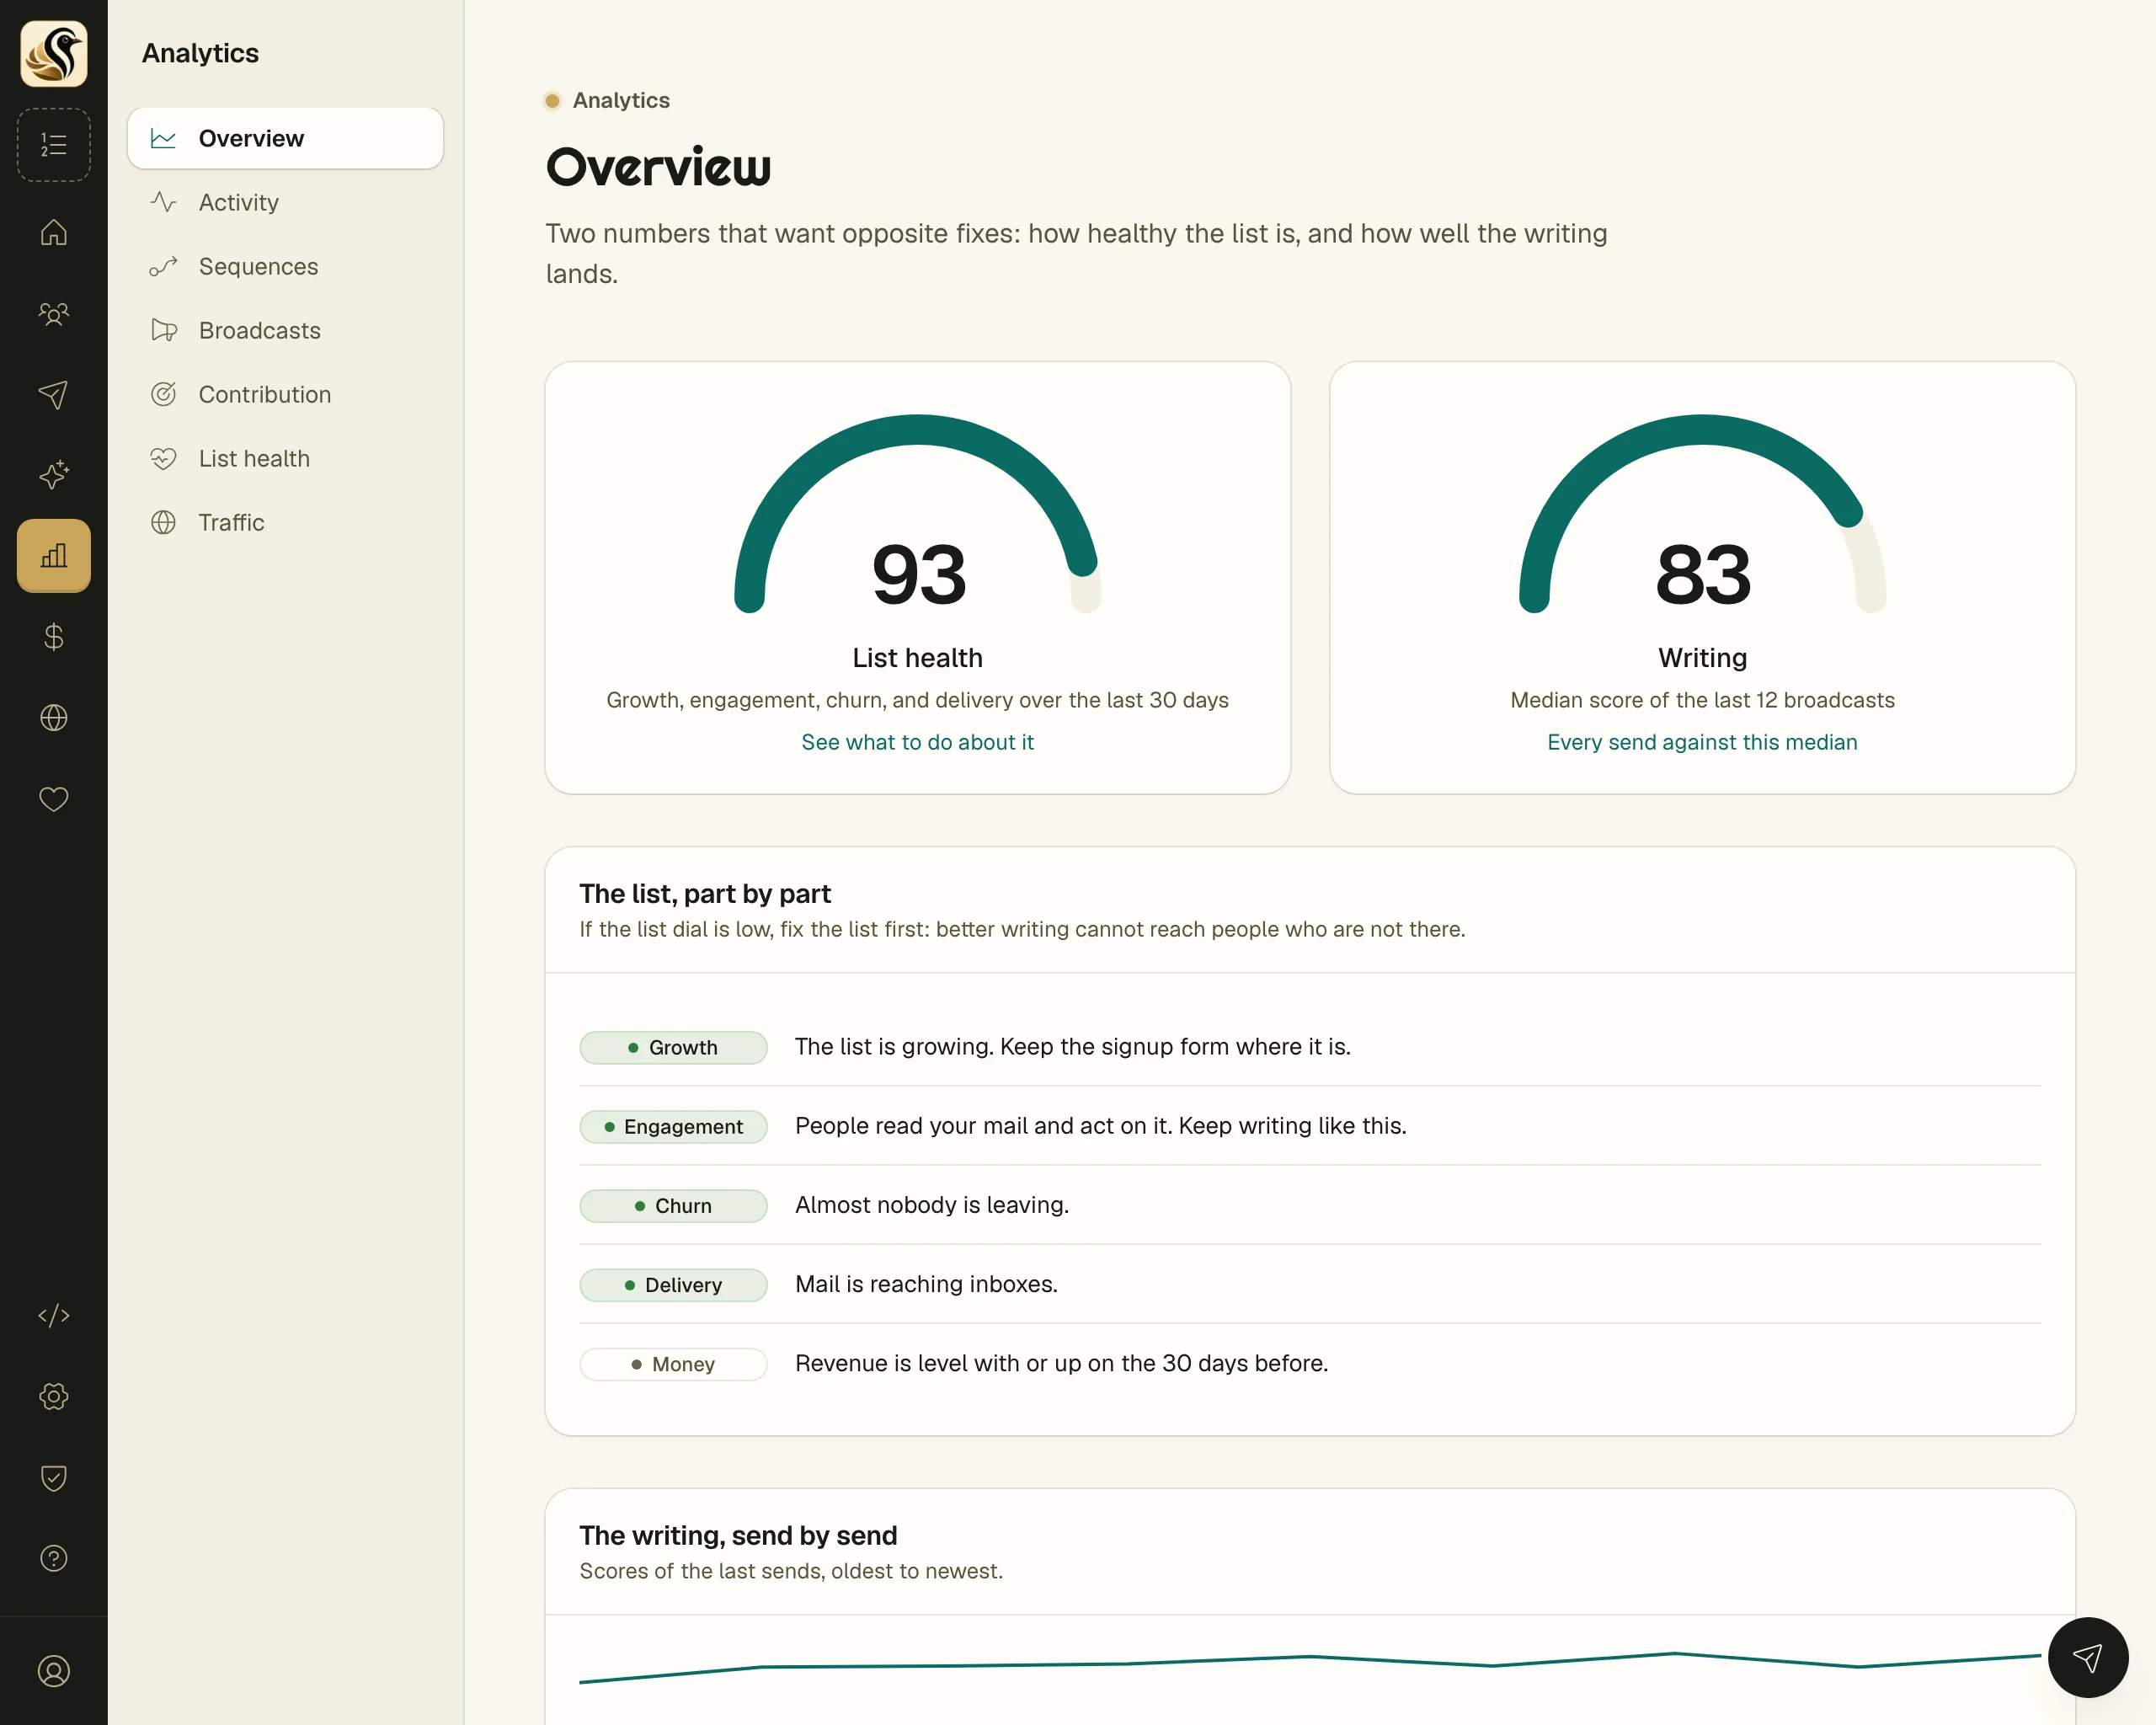
The overview has two numbers that want opposite fixes: how healthy your list is, and how well your writing lands. A list problem and a writing problem need different things from you, so they're kept apart.
-
List health from growth, engagement, churn, and delivery, over the last 30 days against the 30 before. Imports never count as growth, so a big import doesn't make you look good.
-
Writing from the median score of your last 12 broadcasts, so one great or awful send doesn't swing it.
-
One line of advice for each part, "Keep writing like this" or "Start with the subject line", so you know what to do next.
02 Analytics
Every send scored the same way
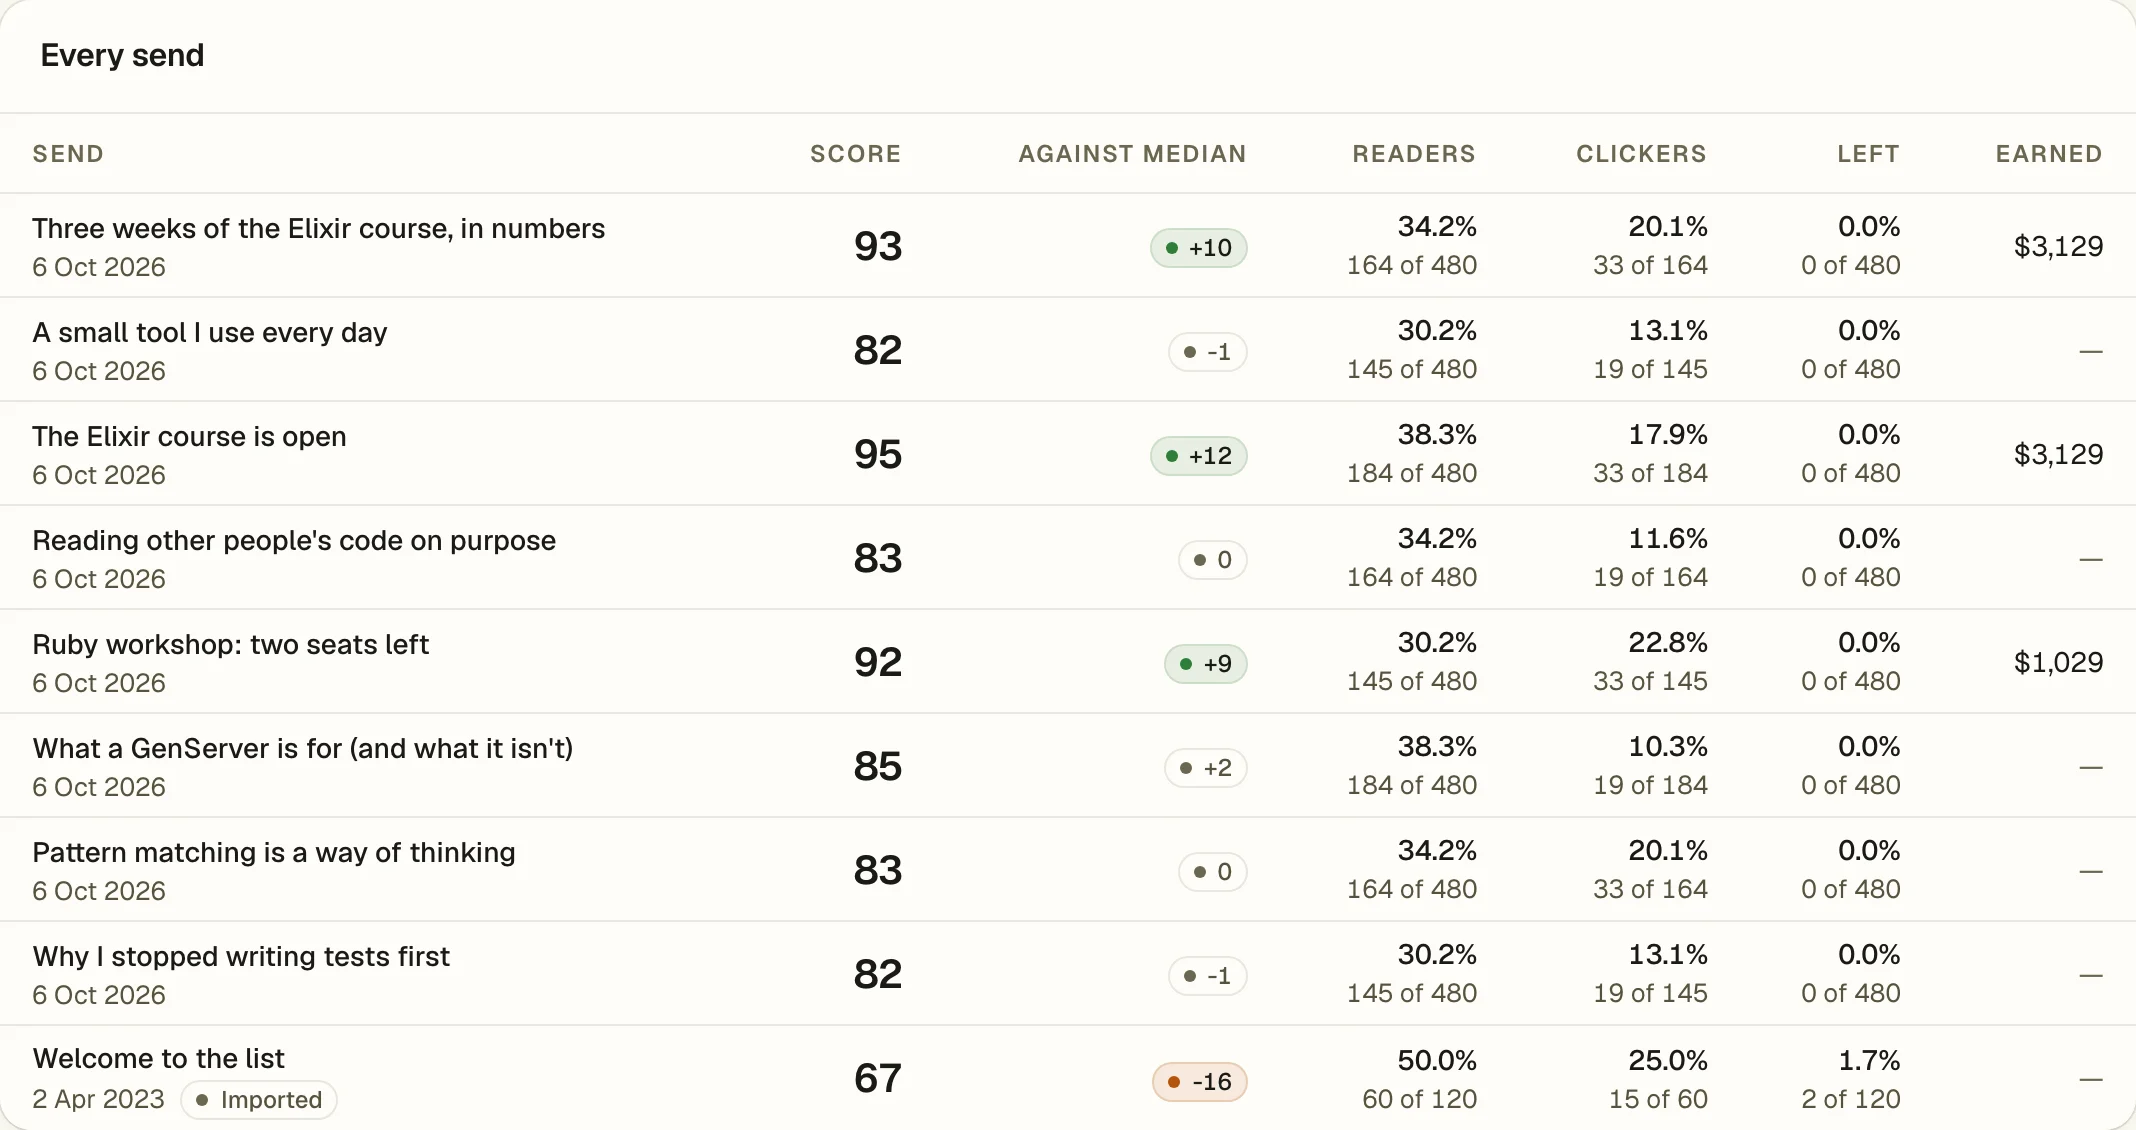
Each broadcast gets a score from 0 to 100 built from four things: how many read it, how many of those clicked, how many it cost you in unsubscribes, and how much money it made. It's set against your own median.
-
Earned, in dollars, for every send, so the post you thought was a dud might turn out to be the one that sold the course.
-
Rates over people reached, that's sent minus bounced, so no rate ever goes over 100%.
-
The two numbers behind every percentage, "34% / 164 of 480", so you can tell a big number from a small sample.
-
A plain verdict, "Read, clicked, and almost nobody left." or "They opened it. They did not act on it."
03 Analytics
People, not machines
Apple's Mail Privacy Protection, link scanners, and corporate proxies all open and click mail without a person involved. Kōlea spots them and marks them, and they never count as a reader.
-
Machine opens marked with a reason, "Apple Mail privacy proxy", "Proxy or link scanner", or "Seconds after sending", so you can see what was filtered and why.
-
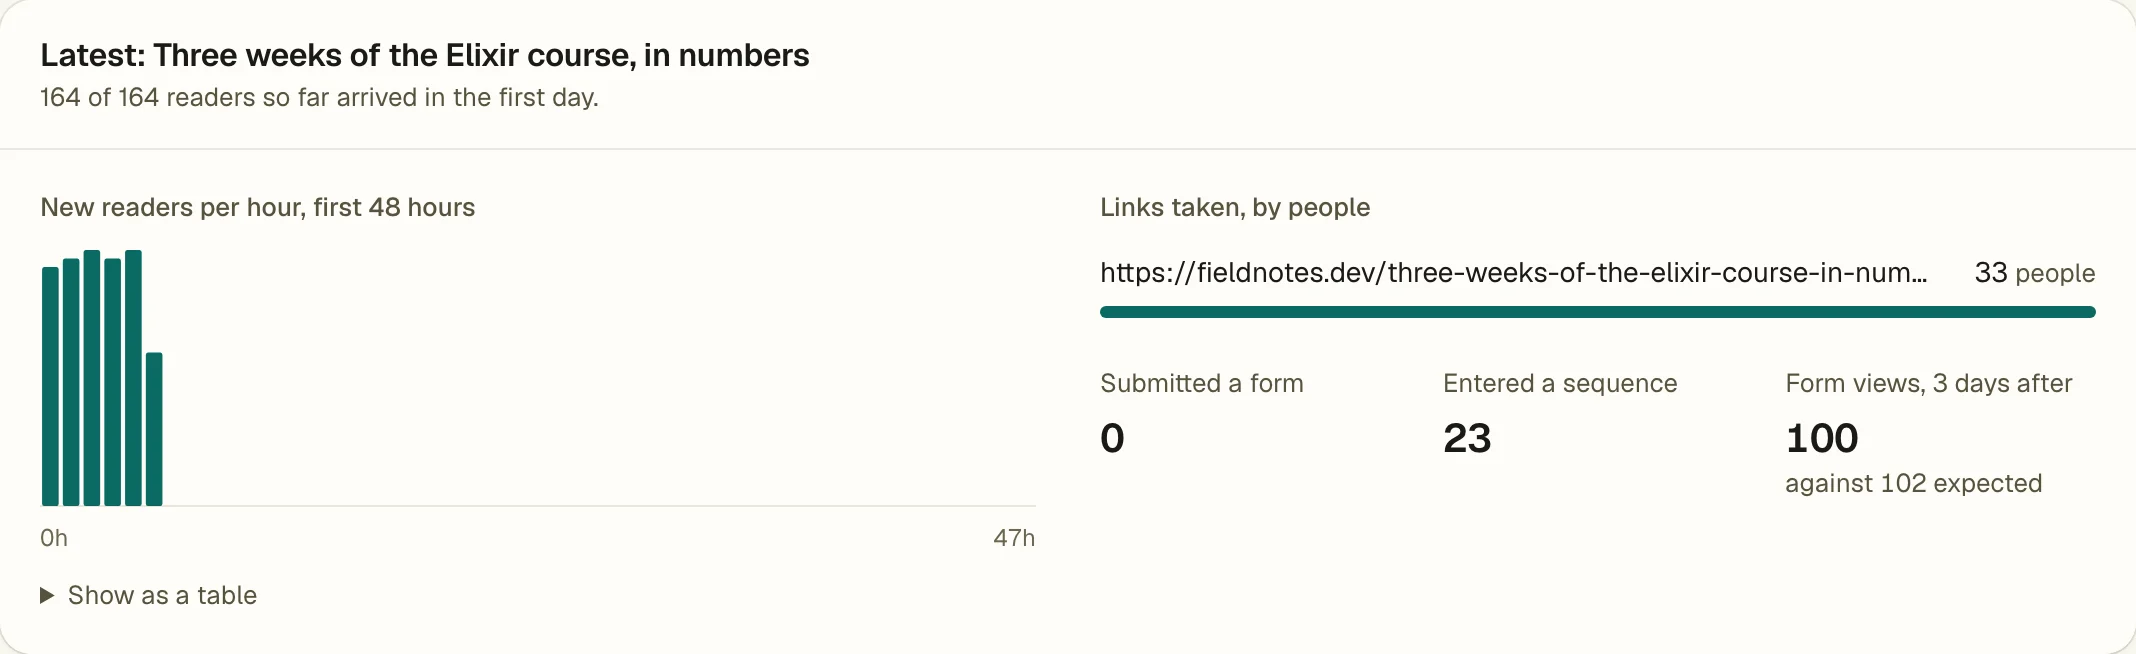
The first 48 hours of a send, by the hour, with the links people took and what they did next: filled in a form, joined a sequence.
-
Traffic on your site without cookies, page views, time on page, where readers came from, and a dotted line on each day a broadcast went out.
04 Analytics
Goals, and which mail moved them
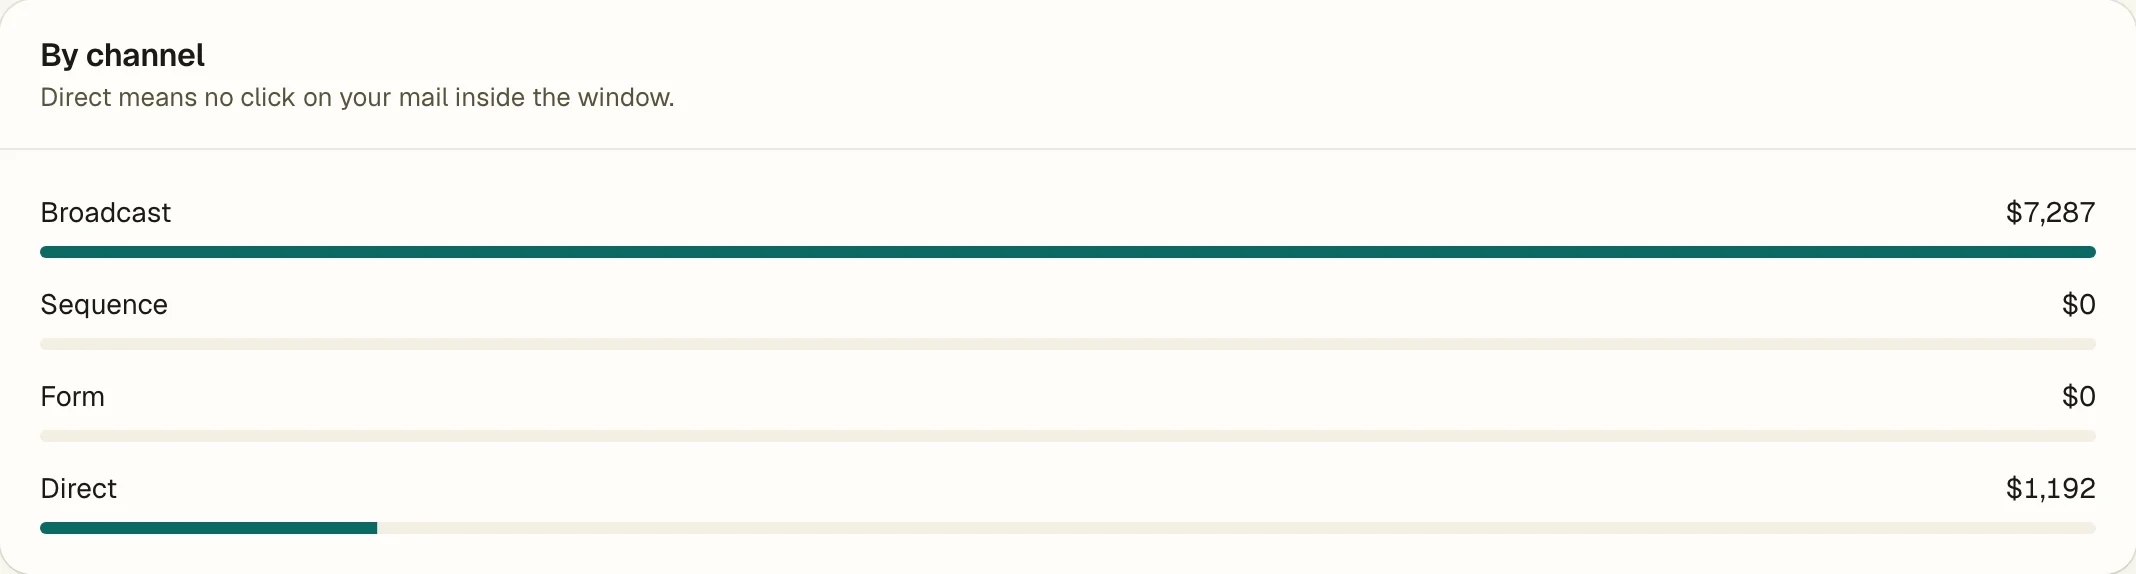
Set a goal for a month, a quarter, or a year in revenue, orders, or conversions. The contribution screen shows how much came from broadcasts, sequences, forms, and direct, and which mail did the most.
-
Named periods only, a month, a quarter, or a year, so every period compares cleanly with the one before.
-
Credit as it was when the money landed, the last click inside the window, or direct. Changing a setting later doesn't rewrite history.
-
A table of which mail contributed what, and its share of the goal, so next quarter you know what to write more of.
The short version
- Revenue by send: what each broadcast, each sequence, and each form earned, in dollars.
- Set a goal for the month, quarter, or year and see which mail moved it.
- Rates are based on the people your email reached (sent minus bounced), so none go over 100%.
- We don't lean on opens much, because Apple opens a lot of email automatically.
- See how many people visited each post, next to what it earned.
Try it on your own list
Free for your first 500 subscribers, no credit card needed. We'll help you move your list over.